Statusline v2: Three Rows, Clickable Links, and a Live Project HUD
Upgrading a Claude Code statusline past one line: a three-row layout, clickable branch and PR links, rate-limit pacing arrows, and a live project-state row for GSD, OpenSpec, and Beads — plus the full updated script and where to start if you're extending your own.
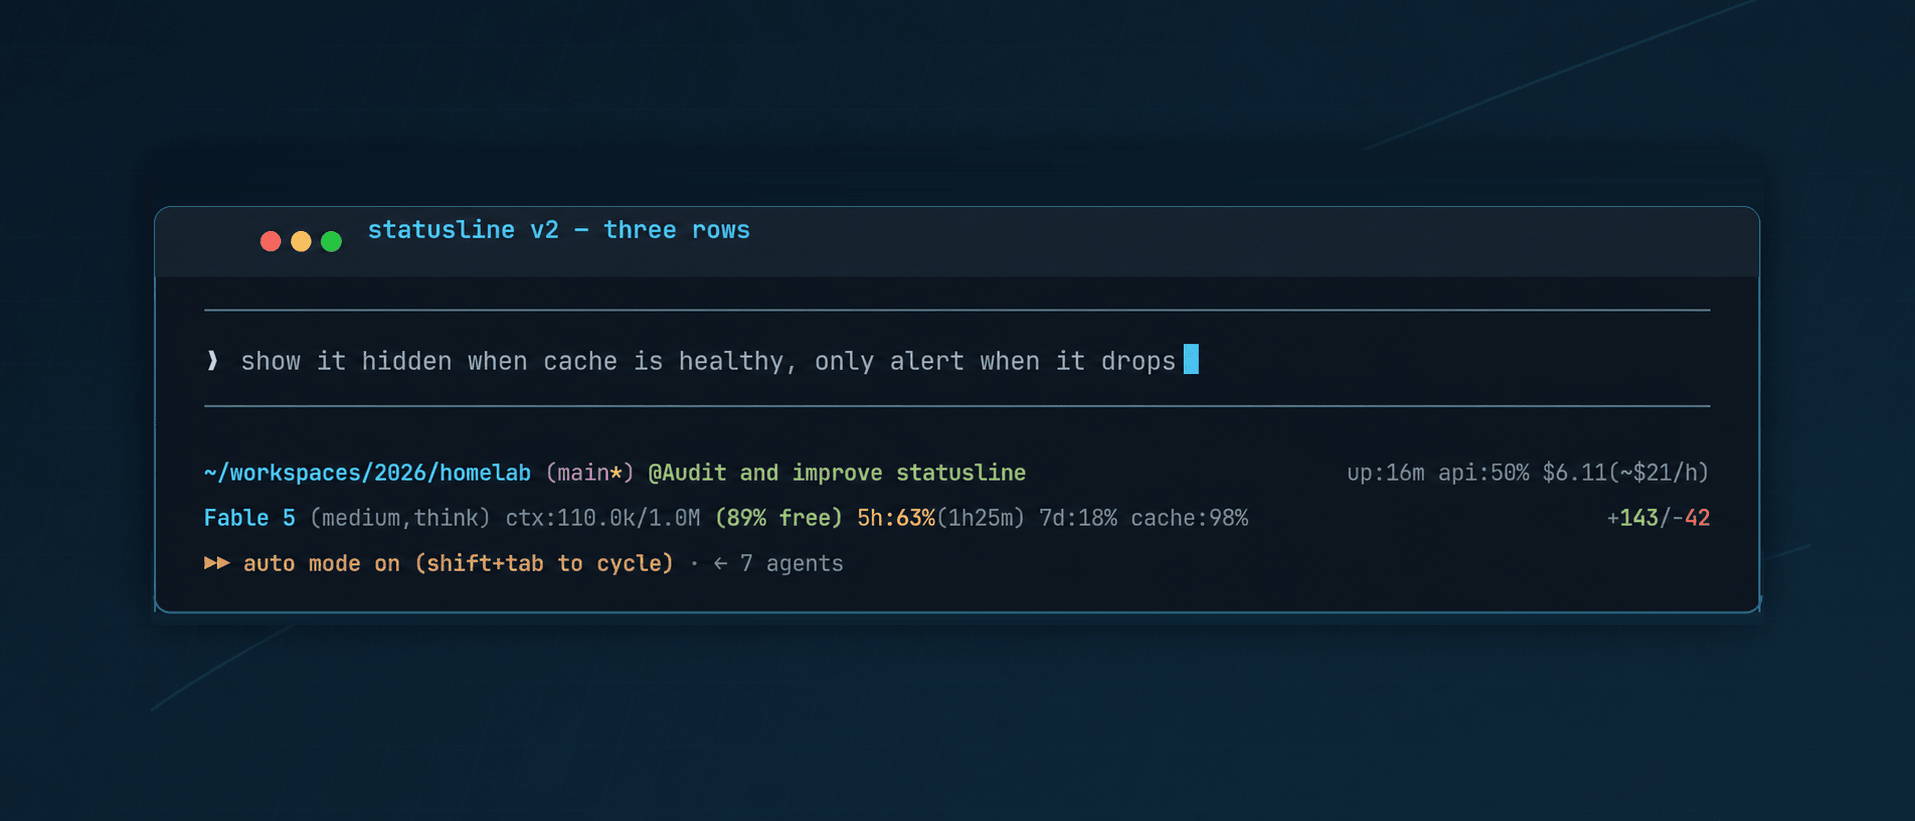
If you set up a statusline after reading Your Statusline Is the Cheapest Feedback Loop in Agentic Coding, you’re probably running some version of the 8-field, single-line script from that post: cwd, branch, model, tokens, diff magnitude, context %, cache ratio, rate limit. It still works. Nothing in this post breaks it or makes it wrong.
What I want to show you is what happens after you live with that line for a couple of months and keep asking yourself questions it can’t answer. Mine grew from roughly 160 lines to 434, and the shape changed completely — one line became three, plain text became clickable links, and a row appeared that has nothing to do with the JSON payload Claude Code sends at all. Every addition below started the same way the fields in the first post did: I kept looking something up by hand, and eventually it annoyed me enough to put on the line instead.
You don’t need to copy all of this. Some of it only makes sense if you’re already running GSD, OpenSpec, or Beads; some of it is useful the moment you open a PR from a Claude Code session, full stop. I’ll flag which is which as we go, so you can pull the pieces that match your own setup and skip the rest. If you haven’t read the first post, start there — it covers the fundamentals (what the statusline actually is, why it costs zero tokens, the fork-count discipline) and none of that is repeated here.
What the line looked like in May
~/workspaces/2023/personal/sharmaprakash-astro (main↑1) Opus 4.7 70.4k tok +93/-45 ctx:93% cc:12k|cr:840k 5h:2%One line. Everything left-aligned. Read left to right, done.
What it looks like now
~/workspaces/2023/personal/sharmaprakash-astro (main*↑1)  #412✓ ci:ok @clipdex-wt3          up:1h13m api:64% $4.82(~$2.10/h)
Fable 5 (max,think)  ctx:412k/1.0M (59% free)  5h:38%(2h10m)  7d:12%(4d)  cache:91%          lines +847/-322
gsd:04-ingest ▶ 3/7  os new:1 wip:2  bd ready:6 wip:2
Three rows. The right-hand side of rows 1 and 2 is a tail — right-aligned against the actual terminal width, not just appended — and row 3 only appears when there’s project state worth showing. On a repo with no GSD phase, no OpenSpec changes, and no Beads issues, row 3 doesn’t render at all, so if none of those tools are in your stack you’ll just never see it.
The branch name and the PR number are clickable in any OSC-8-aware terminal — ⌘-click (or your terminal’s equivalent) opens the GitHub compare view or the PR directly. The path is clickable too, and opens the folder. If you’re jumping between a terminal and a browser tab all day to check “did CI pass yet,” this alone is worth stealing before anything else in this post.
Why the shape changed: one line ran out of room
Here’s the ceiling you’ll hit if you keep adding fields to a single-line statusline: every field pushes the line longer, and past about 90 characters a cockpit indicator — the framing from the original post — starts reading as a wall of text instead. The “earn your character” rule from the first post still holds per-field, but the aggregate keeps growing regardless, for two reasons that apply to you too, not just me: the JSON payload itself keeps growing (Claude Code added pr, worktree, session_name, rate_limits.seven_day, and thinking.enabled since May), and the longer you use a statusline the more project-local state you’ll notice you want that has nothing to do with that payload at all.
If your line is starting to wrap, or you’ve caught yourself deleting a field you liked to make room for a new one, that’s the signal to switch to rows, not squeeze harder. Three rows solved it for me by giving each row a topic instead of treating the whole thing as one flat list:
- Row 1 — place. Where am I, what’s the repo/branch state, is there an open PR and is its CI green, which worktree, which named session. Right tail: session duration, API busy-ratio, cost.
- Row 2 — session. Which model, at what effort, context budget, rate-limit pacing, prompt-cache health. Right tail: diff magnitude.
- Row 3 — project. GSD phase, OpenSpec proposal counts, Beads issue counts — state that lives on disk in the repo, not in the JSON payload, and that I check by hand less and less because it’s just there now.
Splitting by topic also gives you a second lever the single-line design didn’t have: you can apply the “does this earn its place” bar per-row instead of per-line. Row 3 earns its keep as a whole by being absent on most renders — a pattern worth copying even if your three rows end up organized around completely different topics than mine.
The right-aligned tail
If you go multi-row, you’ll hit this problem immediately: you want some information (session cost, diff size) visually separated from the identity information on the left (path, branch, model), and just tacking it onto the end of a long string with a couple of spaces looks sloppy the moment line lengths vary between renders. I wanted up:1h13m api:64% $4.82 to sit flush against the right edge of the terminal instead, and this was the single ugliest problem to solve cheaply.
# Print a row with a right-aligned tail: left(colored), right(colored), right(plain).
# Visible width of the left part = colored string minus ANSI SGR + OSC 8 codes.
print_row() {
  local l_col=$1 r_col=$2 r_txt=$3
  if [ -z "$r_col" ]; then printf '%s\n' "$l_col"; return; fi
  local l_txt
  l_txt=$(printf '%s' "$l_col" | sed -E $'s/\x1b\\[[0-9;]*m//g; s/\x1b]8;;[^\x1b]*\x1b\\\\//g')
  local cols=${COLUMNS:-0}
  [ "$cols" -gt 0 ] 2>/dev/null || cols=$(tput cols 2>/dev/null || echo 120)
  # Claude Code indents the statusline row; reserve a margin to avoid clipping
  local pad=$(( cols - 4 - ${#l_txt} - ${#r_txt} ))
  [ "$pad" -lt 1 ] && pad=1
  printf '%s%*s%s\n' "$l_col" "$pad" "" "$r_col"
}
The trap: you can’t measure width on the colored string directly, because ANSI SGR codes (\033[38;5;81m) and OSC 8 hyperlink codes (\033]8;;url\033\\) count as zero visible columns but non-zero string length. So the function keeps two copies of the left side — the colored one for output, and a stripped one purely for width math — and pads with printf '%*s'. $COLUMNS isn’t reliably exported to the statusline’s subprocess, so it falls back to tput cols, and if that fails too, a hardcoded 120.
One sed fork per row that has a tail. Given rows only get a tail when there’s something to show on the right, this is a fork you pay occasionally, not every render.
Clickable everything: OSC 8 in a statusline
OSC 8 is the terminal escape sequence for hyperlinks — supported in iTerm2, Kitty, WezTerm, and modern Ghostty; silently ignored (prints as plain text) everywhere else, which makes it free to add with no fallback branch needed.
esc=$'\033'
link() { printf '%s]8;;%s%s\\%s%s]8;;%s\\' "$esc" "$1" "$esc" "$2" "$esc" "$esc"; }
Three places I wire it in:
- cwd →
file://URL. Click the path, the terminal (or an OS handler) opens the folder. - branch → GitHub compare/tree URL, built from
workspace.repo.host/owner/nameplus the branch name pulled out ofgit status --porcelain=v2 --branch. Only rendered whenrepo_hostis present — local-only repos just show plain text. - PR number → the PR URL, from
.pr.urlin the JSON payload.
if [ -n "$repo_host" ] && [ -n "$branch" ] && [ "$branch" != "-" ]; then
  printf " ${DIM}(${RESET}%s${DIM})${RESET}" "$(link "https://$repo_host/$repo_owner/$repo_name/tree/$branch" "$branch_str")"
fi
Zero added forks — link() is pure printf. The only cost is that the string is longer, which is exactly what print_row’s stripped-width math exists to correct for.
PR and CI status: the field worth adding if you run parallel sessions
Claude Code’s JSON payload picked up a .pr object at some point — number, URL, review state — for sessions started against a branch with an open PR. I ignored it for weeks because “is there a PR” felt like something to check with gh pr status, not something that belongs on a per-keystroke render.
Add this one if you recognize this failure mode: a PR goes to changes_requested while you’re heads-down in a different repo’s session, and you don’t find out until the next day. The number itself isn’t the signal — the review-state icon is:
case "$pr_state" in
  approved)          pr_icon="✓"; pr_color=$GREEN ;;
  changes_requested) pr_icon="✗"; pr_color=$RED ;;
  draft)             pr_icon="◐"; pr_color=$DIM ;;
  pending)           pr_icon="●"; pr_color=$YELLOW ;;
esac
CI status rides alongside it, but gh pr checks is not statusline-render-cheap — call it on every render and you’ve added a real network round-trip to every keystroke. So it’s cached:
if [ "$ci_age" -ge 120 ]; then
  ( cd "$root" && gh pr checks "$pr_num" --json bucket 2>/dev/null \
      | jq -r 'if length==0 then "none"
               elif any(.[]; .bucket=="fail") then "fail"
               elif any(.[]; .bucket=="pending") then "pending"
               else "pass" end' > "$ci_cache.$$" 2>/dev/null \
      && mv -f "$ci_cache.$$" "$ci_cache" || rm -f "$ci_cache.$$" ) >/dev/null 2>&1 &
fi
Read the cache file synchronously (near-zero cost), and if it’s stale (≥120s old), kick off a refresh in the background — & at the end, no wait — and render the stale value immediately rather than blocking the statusline on a network call. The next render, or the one after, picks up the fresh value.
This is the pattern to take away even if you never touch PR/CI: cache to a file, refresh in the background, never block the render. Anything you want on your own statusline that costs more than a few milliseconds — an API call, a slow CLI, a database query — goes through this same shape. I reuse it below for Beads.
Rate limits: from a raw percentage to a pacing signal
The original showed 5h:2% — just the number, shown only when non-zero. That answers “how much have I used” but not the more useful question: am I on track to hit the cap before it resets?
rl_seg() {
  local pct=$2
  [ -z "$pct" ] && return
  local p=${pct%.*}; p=${p:-0}
  local rem=$(( ${3:-0} - now ))
  local soften=${4:-0} win=${5:-0}
  local c=$DIM
  if   [ "$p" -ge 80 ]; then c=$RED
  elif [ "$p" -ge 50 ]; then c=$YELLOW
  fi
  # High usage is less alarming when the window resets soon
  if [ "$rem" -gt 0 ] && [ "$rem" -le "$soften" ]; then
    if   [ "$c" = "$RED" ];    then c=$YELLOW
    elif [ "$c" = "$YELLOW" ]; then c=$DIM
    fi
  fi
  # Pace: is usage running ahead of the elapsed fraction of the window?
  local pace=""
  if [ "$win" -gt 0 ] && [ "$rem" -gt 0 ] && [ "$rem" -lt "$win" ]; then
    local elapsed_pct=$(( (win - rem) * 100 / win ))
    [ "$p" -ge 30 ] && [ "$p" -gt $(( elapsed_pct + 10 )) ] && pace="▲"
  fi
  local t; t=$(countdown "$3")
  printf " ${c}%s:%s%%${RESET}" "$1" "$p"
  [ -n "$pace" ] && printf "${RED}▲${RESET}"
  [ -n "$t" ] && printf "${DIM}(%s)${RESET}" "$t"
}
Two ideas stacked here, and both apply to you if you’re on any plan tier with a rolling rate limit, not just mine:
- Soften near reset. 85% usage with two hours left in the window is a real warning. 85% usage with four minutes left is irrelevant — the window is about to reset anyway. The
softenwindow steps the color down one level once you’re inside it, so the color stops lying to you right before a reset. - Pace, not just level. If you’re 30% into a 5-hour window but already at 40% usage, you’re burning faster than the window can absorb — that’s the
▲marker, independent of the raw percentage’s color. This is the field that’s changed my own behavior the most this quarter. A bare percentage only tells you where you are; the arrow tells you where you’re headed, before the number itself looks alarming. If you’ve ever hit a rate-limit wall mid-task and thought “how did I not see that coming,” this is the fix.
Both 5h and 7d render through the same function with different soften/window constants, plus a countdown to reset in parens: 5h:38%(2h10m).
Cache health: from raw counts to a hit-rate percentage
May’s version showed cc:12k|cr:840k — raw cache-creation and cache-read token counts, colored by their ratio. It worked, but it required doing the ratio math in your head every time you looked at it.
The current version computes the percentage directly and calls it what it is — a cache hit rate on the last request:
cache_tot=$(( cur_in + cache_rd + cache_cr ))
if [ "$cache_tot" -gt 0 ]; then
  cache_pct=$(( cache_rd * 100 / cache_tot ))
  cc=$DIM
  if   [ "$cache_pct" -lt 50 ]; then cc=$RED
  elif [ "$cache_pct" -lt 80 ]; then cc=$YELLOW
  fi
  printf " ${cc}cache:%s%%${RESET}" "$cache_pct"
fi
cache:91% is legible at a glance in a way cc:12k|cr:840k never was — no mental division required, and the color threshold does the “is this healthy” judgment for you. If you copied the original post’s cc:/cr: fields, this is a straight swap: same underlying JSON fields, better math, delete the old block and drop this one in.
Context, rewritten as used/window instead of a bare percentage
ctx:93% in the old version told you how much was left but not of what. On a 200k session and a 1M session, 93% free means very different absolute numbers of tokens you can still spend. The current line shows both:
if [ -n "$ctx" ] && [ "$ctx_size" -gt 0 ] 2>/dev/null; then
  used_tok=$(( ctx_size - ctx_size * ctx_int / 100 ))
  printf " ${DIM}ctx:${RESET}${ctx_color}%s${RESET}${DIM}/%s${RESET}" \
    "$(humanize "$used_tok")" "$(humanize "$ctx_size")"
  printf " ${DIM}(${RESET}${ctx_color}%s%%${RESET}${DIM} free)${RESET}" "$ctx_int"
fi
ctx:412k/1.0M (59% free) — same threshold coloring as before (green >50% free, yellow 20–50%, red <20%), but now anchored to an absolute number. Falls back to the old bare-token count (total_tok) when the window size isn’t reported yet, early in a session.
Session duration, API busy-ratio, and burn rate
New this round, and worth adding even if you don’t care about the other project-state fields — this one answers a question every long agentic session eventually raises: is the agent actually doing the work right now, or am I the bottleneck?
if [ "$api_ms" -gt 0 ] && [ "$dur_ms" -gt 0 ]; then
  api_pct=$(( api_ms * 100 / dur_ms ))
  ...
fi
api:64% is the fraction of wall-clock session time the model actually spent generating or calling tools, versus idle waiting on me to read and type. A session running near 90% is autonomous grind — I kicked off a long task and stepped away. One at 20% is me reading, thinking, and typing between short turns. Neither is wrong, but knowing which mode I’m in mid-session is a genuinely new signal the original line didn’t have room for.
Cost got a burn-rate companion once a session passes five minutes:
if [ "$dur_ms" -ge 300000 ]; then
  cents=${cost_str#\$}; cents=${cents/./}
  rate=$(( cents * 36000 / dur_ms ))
  [ "$rate" -ge 1 ] && rate_str="~\$$rate/h"
fi
$4.82(~$2.10/h) — the absolute number matters less than the trajectory on a long session. Cost itself is now tiered (dim under $10, yellow under $30, orange above), the same “status not trivia” treatment the rate-limit segments get.
Row 3: project state that isn’t in the JSON payload at all
This is the biggest structural addition, and it’s also the part of this post least likely to transfer to your setup unmodified — it’s read straight off the filesystem, and it assumes tools you may not run. Read it as a template, not a checklist: the shape (read a project file or run a project CLI, cache it, render it only when it has something to say) is the reusable part even if GSD, OpenSpec, and Beads mean nothing to you.
GSD phase, from .planning/STATE.md frontmatter — current phase, status glyph (▶ executing, ✓ complete, ✗ blocked, ◆ other), and plan progress as done/total:
if [ -f "$root/.planning/STATE.md" ]; then
  read -r g_phase g_status g_done g_total < <(awk -F': ' '
    NR>30 {exit}
    $1=="current_phase"   {p=$2}
    $1=="status"          {s=$2}
    $1=="completed_plans" {c=$2}
    $1=="total_plans"     {t=$2}
    END {print (p!=""?p:"-"), (s!=""?s:"-"), (c!=""?c:0), (t!=""?t:0)}
  ' "$root/.planning/STATE.md")
  ...
fi
gsd:04-ingest ▶ 3/7 — I no longer run gsd-progress just to check where a phase stands; it’s on the line I already look at every render. If there’s a paused handoff waiting (.planning/HANDOFF.md exists), a red handoff! appends — otherwise it’s invisible until it’s relevant, which is the whole design bar from the first post applied to a new source.
OpenSpec proposals, counted and split into not-started vs in-flight:
if [ -d "$root/openspec/changes" ]; then
  os_new=0; os_wip=0
  for d in "$root/openspec/changes"/*/; do
    [ -d "$d" ] || continue
    case "$d" in */archive/) continue ;; esac
    if [ -f "${d}tasks.md" ] && grep -q '\[x\]' "${d}tasks.md" 2>/dev/null; then
      os_wip=$((os_wip+1))
    else
      os_new=$((os_new+1))
    fi
  done
  ...
fi
os new:1 wip:2 — a proposal counts as in-flight the moment any checkbox in its tasks.md is checked; otherwise it’s “new.” The new count turns red at 3+, which is not an arbitrary threshold — it’s the same number my em fan-out orchestrator uses to decide whether a repo has “accumulated enough” not-started proposals to justify a parallel worktree fan-out instead of grinding serially. The statusline color and the orchestrator’s dispatch rule now agree with each other, which wasn’t a deliberate design goal so much as a happy consequence of both reading the same directory the same way.
Beads issue counts, the one genuinely expensive call in the whole script:
if [ -d "$root/.beads" ] && command -v bd >/dev/null 2>&1; then
  cache="$cache_dir/bds-$key"
  ...
  if [ "$age" -ge 120 ]; then
    ( cd "$root" && bd stats --json 2>/dev/null \
        | jq -r '.summary | "\(.ready_issues) \(.in_progress_issues) \(.blocked_issues)"' \
        > "$cache.$$" 2>/dev/null && mv -f "$cache.$$" "$cache" || rm -f "$cache.$$" ) >/dev/null 2>&1 &
  fi
  ...
fi
bd stats takes close to a second — utterly unacceptable to run inline on every render. Same background-refresh-behind-a-cache pattern as the CI check, keyed per-repo (cksum of the repo root path) so multiple projects don’t clobber each other’s cache files. A trailing ~ on the segment means “this is a stale value, a refresh is running” — bd ready:6 wip:2~.
Row 3 as a whole only renders when at least one of these three sources has something to say. On a plain repo with no .planning/, no openspec/, and no .beads/, the row is simply absent — the “does this earn its place” bar applied at the row level, not just the field level.
None of my three sources need to be yours. The same shape works for Jira (jira issue list --jql "assignee=currentUser() AND status='In Progress'" | jq length, cached the same way as Beads), a Linear API call, or even a plain git log --since=yesterday --oneline | wc -l if all you want is “how much have I actually shipped today.” Pick the one project-state question you look up by hand most often, and that’s your row 3.
Model badge: qualifiers instead of a bare name
The old line showed Opus 4.7 — name only, trimmed of the (1M context) suffix. The current badge adds the things that actually change what I’m paying per token:
case "$effort" in
  max)  ecol=$C_EFF_MAX ;;   # red — most expensive
  high) ecol=$C_EFF_HIGH ;;  # yellow
  low)  ecol=$DIM ;;
  *)    ecol=$C_EFF_MED ;;   # cyan — default
esac
...
[ -n "$effort" ]      && add_qual "$ecol" "$effort"
[ "$fast" = "true" ]  && add_qual "$C_FAST" "fast"
[ "$think" = "true" ] && add_qual "$DIM" "think"
Fable 5 (max,think) — model name in its identity hue, qualifiers in dim parens colored by spend tier. max effort is a real cost multiplier, so it gets red; low is dim because it’s the cheap end. This is the same “color signals cost” instinct behind the rate-limit and cost-tier treatments — reasoning effort just hadn’t shown up in the JSON payload back in May.
One thing worth flagging if you’re tempted to go further than I did: it’s appealing to make the model-identity colors also signal cost — give your highest-spend model a hot color, everything else cool. I looked at it, since Fable is my highest-spend model by a wide margin, and decided against it. Identity color and cost color are answering two different questions, and collapsing them into one hue means that hue has to mean two things depending on context — which model is this, versus is this expensive right now. Keep them separate: cost already has its own signals (the effort qualifiers, the $ tier, the burn rate), so let the model name just say which model, unambiguously, every time.
Add this even if you skip everything else: a debug line
This is the one field that isn’t visible in the rendered output at all, and it’s the highest-value-per-line-of-code addition in the whole file — add it before you build anything else on top of the JSON payload:
input=$(cat)
printf '%s' "$input" > "$HOME/.cache/claude-statusline/last-input.json" 2>/dev/null
Every render overwrites a tiny file with the raw JSON payload Claude Code just sent. When a new field shows up in a CLI release — rate_limits.seven_day and .pr both arrived this way — I don’t have to go hunting for docs or dump it manually mid-session. I just cat ~/.cache/claude-statusline/last-input.json | jq between renders. This is the single cheapest addition in the whole file relative to how many times it’s saved me a debugging round-trip.
What stayed exactly the same
Worth naming, because it’s easy to assume everything changed:
- The
caseform for$HOMEcollapse. Still the portable fix for the${var/pattern/replacement}bash/zsh trap from the first post. Nobody’s found a better way in three months. - One
jqcall for the whole payload, still parsed by a singleread. It’s grown to 30 fields, but it’s still one fork. (One implementation detail did change: the delimiter moved from@tsv/tab to\x1f, the ASCII unit separator — tab is IFS whitespace, soreadcollapses empty middle fields and silently shifts everything after them.\x1fisn’t whitespace, so empty fields stay in place. This bit me once withrate_limits.seven_daylanding in the wrong variable, and cost about twenty minutes to find.) - Bash integer math for humanizing numbers.
humanize()is unchanged. Nobc, ever. - The performance bar. Two-to-three forks per render depending on whether CI/Beads caches need a background refresh (which doesn’t block the render). Still comfortably under 20ms on a normal render.
The full script
Every snippet above is an excerpt. Since this post, I’ve split the script into namespaced modules and pulled it out into its own repo — agent-statusline — with a build.sh that flattens the modules into the single fork-free file Claude Code actually runs, ShellCheck-clean CI on every push, and a versioned release. If you’d rather grab it than copy-paste, here are the fastest paths.
Homebrew — puts agent-statusline on your PATH, no ~/.claude path to remember:
brew install tokdio/tap/agent-statuslinebrew info agent-statusline prints the exact statusLine block to paste into ~/.claude/settings.json.
Or curl the prebuilt script directly:
curl -fsSL "https://github.com/poudelprakash/agent-statusline/releases/latest/download/statusline-command.sh?utm_source=sharmaprakash-blog&utm_medium=referral&utm_campaign=statusline-v2&utm_content=curl-oneliner" \
  -o ~/.claude/statusline-command.sh
chmod +x ~/.claude/statusline-command.sh
Otherwise, here’s the whole thing inline, in one piece, the way it actually runs on my machine — drop it in over the version from the first post if you want to start from the current state instead of rebuilding it field by field.
#!/bin/bash
input=$(cat)
# Debug: keep last real payload for inspection (tiny; overwritten each run)
printf '%s' "$input" > "$HOME/.cache/claude-statusline/last-input.json" 2>/dev/null

# One jq call: all fields joined with the ASCII unit separator (\x1f).
# NOT @tsv: tab is IFS whitespace, so bash `read` collapses empty middle
# fields; \x1f is non-whitespace and preserves them.
IFS=$'\x1f' read -r cwd model in_tok out_tok lines_add lines_rem ctx ctx_size style \
  sess_name effort fast rl5 rl5_reset rl7 rl7_reset wt gwt pr_num pr_url pr_state \
  dur_ms cost_usd x200k repo_host repo_owner repo_name \
  cur_in cache_rd cache_cr api_ms think < <(
  printf '%s' "$input" | jq -r '[
    .cwd // "",
    .model.display_name // "",
    .context_window.total_input_tokens // 0,
    .context_window.total_output_tokens // 0,
    .cost.total_lines_added // 0,
    .cost.total_lines_removed // 0,
    .context_window.remaining_percentage // "",
    .context_window.context_window_size // 0,
    .output_style.name // "",
    .session_name // "",
    .effort.level // "",
    (.fast_mode // false),
    .rate_limits.five_hour.used_percentage // "",
    .rate_limits.five_hour.resets_at // 0,
    .rate_limits.seven_day.used_percentage // "",
    .rate_limits.seven_day.resets_at // 0,
    .worktree.name // "",
    .workspace.git_worktree // "",
    .pr.number // "",
    .pr.url // "",
    .pr.review_state // "",
    .cost.total_duration_ms // 0,
    .cost.total_cost_usd // "",
    (.exceeds_200k_tokens // false),
    .workspace.repo.host // "",
    .workspace.repo.owner // "",
    .workspace.repo.name // "",
    .context_window.current_usage.input_tokens // 0,
    .context_window.current_usage.cache_read_input_tokens // 0,
    .context_window.current_usage.cache_creation_input_tokens // 0,
    .cost.total_api_duration_ms // 0,
    (.thinking.enabled // false)
  ] | map(tostring) | join("\u001f")' 2>/dev/null
)

# Harden numerics against a failed/partial jq parse
in_tok=${in_tok:-0}; out_tok=${out_tok:-0}
lines_add=${lines_add:-0}; lines_rem=${lines_rem:-0}
ctx_size=${ctx_size:-0}; rl5_reset=${rl5_reset:-0}; rl7_reset=${rl7_reset:-0}
dur_ms=${dur_ms:-0}
cur_in=${cur_in:-0}; cache_rd=${cache_rd:-0}; cache_cr=${cache_cr:-0}; api_ms=${api_ms:-0}

# Colors — base palette (traffic-light colors, reserved for STATUS only)
CYAN='\033[0;36m'; GREEN='\033[0;32m'; YELLOW='\033[0;33m'
RED='\033[0;31m';  MAGENTA='\033[0;35m'; DIM='\033[2m'; RESET='\033[0m'

# 256-color identity palette: path/branch/model/session get their own hues so
# green/yellow/red keep semantic meaning. Falls back to base colors only when
# TERM affirmatively reports <256 (statusline env usually has no usable TERM).
if [ -n "$TERM" ] && [ "$(tput colors 2>/dev/null || echo 256)" -lt 256 ]; then
  C_PATH=$CYAN;   C_BRANCH=$GREEN;  C_DIRTY=$YELLOW
  C_AHEAD=$GREEN; C_BEHIND=$RED;    C_WT=$MAGENTA
  C_SESS=$DIM;    C_HANDOFF=$RED;   C_FAST=$CYAN
  C_EFF_MED=$CYAN; C_EFF_HIGH=$YELLOW; C_EFF_MAX=$RED
  C_COST_WARN=$YELLOW; C_COST_HOT=$RED
  M_FABLE=$YELLOW; M_OPUS=$YELLOW; M_SONNET=$YELLOW; M_HAIKU=$YELLOW
else
  C_PATH='\033[38;5;81m';    C_BRANCH='\033[38;5;140m'; C_DIRTY='\033[38;5;220m'
  C_AHEAD='\033[38;5;114m';  C_BEHIND='\033[38;5;203m'; C_WT='\033[38;5;175m'
  C_SESS='\033[38;5;110m';   C_HANDOFF='\033[1;38;5;203m'; C_FAST='\033[38;5;123m'
  C_EFF_MED='\033[38;5;75m'; C_EFF_HIGH='\033[38;5;214m'; C_EFF_MAX='\033[38;5;203m'
  C_COST_WARN='\033[38;5;220m'; C_COST_HOT='\033[38;5;208m'
  M_FABLE='\033[38;5;141m'; M_OPUS='\033[38;5;208m'
  M_SONNET='\033[38;5;75m'; M_HAIKU='\033[38;5;114m'
fi

now=$(date +%s)

# cwd: replace $HOME with ~
case "$cwd" in
  "$HOME")   short_cwd="~" ;;
  "$HOME"/*) short_cwd="~${cwd#$HOME}" ;;
  *)         short_cwd="$cwd" ;;
esac

# Git: branch + dirty + ahead/behind in ONE call, parsed with ONE awk
branch_str=""
if [ -n "$cwd" ] && { [ -d "$cwd/.git" ] || git -C "$cwd" rev-parse --git-dir >/dev/null 2>&1; }; then
  gs=$(git -C "$cwd" --no-optional-locks status --porcelain=v2 --branch 2>/dev/null)
  read -r branch ab_a ab_b dirty < <(awk '
    $2=="branch.head" {b=$3}
    $2=="branch.ab"   {a=$3; c=$4}
    !/^#/ && NF        {d=1}
    END {print (b?b:"-"), (a?a:"+0"), (c?c:"-0"), (d?1:0)}
  ' <<<"$gs")
  # Name in identity violet; the markers are STATES, so they get state colors
  printf -v branch_str "${C_BRANCH}%s${RESET}" "$branch"
  [ "$dirty" = "1" ]   && printf -v branch_str "%s${C_DIRTY}*${RESET}" "$branch_str"
  [ "$ab_a" != "+0" ]  && printf -v branch_str "%s${C_AHEAD}↑%s${RESET}" "$branch_str" "${ab_a#+}"
  [ "$ab_b" != "-0" ]  && printf -v branch_str "%s${C_BEHIND}↓%s${RESET}" "$branch_str" "${ab_b#-}"
fi

# Humanize tokens (bash integer math, no fork)
humanize() {
  local n=$1
  if   [ "$n" -ge 1000000 ]; then printf "%s.%sM" "$((n/1000000))" "$(( (n/100000)%10 ))"
  elif [ "$n" -ge 1000 ];    then printf "%s.%sk" "$((n/1000))"    "$(( (n/100)%10 ))"
  else printf "%s" "$n"
  fi
}

# Span of seconds as "2d3h" / "1h13m" / "45m"; empty if <=0
fmt_span() {
  local t=${1:-0}
  [ "$t" -le 0 ] && return
  local d=$((t/86400)) h=$((t%86400/3600)) m=$((t%3600/60))
  if   [ "$d" -gt 0 ]; then printf "%sd%sh" "$d" "$h"
  elif [ "$h" -gt 0 ]; then printf "%sh%sm" "$h" "$m"
  else printf "%sm" "$m"
  fi
}

# Countdown to an epoch
countdown() { fmt_span $(( ${1:-0} - now )); }

# Rate-limit segment: label, used%, resets_at epoch, soften-window secs, window secs.
# High usage is less alarming when the window resets soon: within the soften
# window the color steps down one level (red→yellow, yellow→dim).
# Pace: window start = resets_at - window; if used% is running ahead of the
# elapsed fraction of the window (with margin), you're on track to hit the
# cap before it resets → red ▲.
rl_seg() {
  local pct=$2
  [ -z "$pct" ] && return
  local p=${pct%.*}; p=${p:-0}
  local rem=$(( ${3:-0} - now ))
  local soften=${4:-0} win=${5:-0}
  local c=$DIM
  if   [ "$p" -ge 80 ]; then c=$RED
  elif [ "$p" -ge 50 ]; then c=$YELLOW
  fi
  if [ "$rem" -gt 0 ] && [ "$rem" -le "$soften" ]; then
    if   [ "$c" = "$RED" ];    then c=$YELLOW
    elif [ "$c" = "$YELLOW" ]; then c=$DIM
    fi
  fi
  local pace=""
  if [ "$win" -gt 0 ] && [ "$rem" -gt 0 ] && [ "$rem" -lt "$win" ]; then
    local elapsed_pct=$(( (win - rem) * 100 / win ))
    [ "$p" -ge 30 ] && [ "$p" -gt $(( elapsed_pct + 10 )) ] && pace="▲"
  fi
  local t; t=$(countdown "$3")
  printf " ${c}%s:%s%%${RESET}" "$1" "$p"
  [ -n "$pace" ] && printf "${RED}▲${RESET}"
  [ -n "$t" ] && printf "${DIM}(%s)${RESET}" "$t"
}

# OSC 8 hyperlink (clickable in iTerm2/Kitty/WezTerm, harmless elsewhere)
esc=$'\033'
link() { printf '%s]8;;%s%s\\%s%s]8;;%s\\' "$esc" "$1" "$esc" "$2" "$esc" "$esc"; }

# Print a row with a right-aligned tail: left(colored), right(colored), right(plain).
# Visible width of the left part = colored string minus ANSI SGR + OSC 8 codes.
print_row() {
  local l_col=$1 r_col=$2 r_txt=$3
  if [ -z "$r_col" ]; then printf '%s\n' "$l_col"; return; fi
  local l_txt
  l_txt=$(printf '%s' "$l_col" | sed -E $'s/\x1b\\[[0-9;]*m//g; s/\x1b]8;;[^\x1b]*\x1b\\\\//g')
  local cols=${COLUMNS:-0}
  [ "$cols" -gt 0 ] 2>/dev/null || cols=$(tput cols 2>/dev/null || echo 120)
  # Claude Code indents the statusline row; reserve a margin to avoid clipping
  local pad=$(( cols - 4 - ${#l_txt} - ${#r_txt} ))
  [ "$pad" -lt 1 ] && pad=1
  printf '%s%*s%s\n' "$l_col" "$pad" "" "$r_col"
}

total_tok=$(( in_tok + out_tok ))
tok_str=$(humanize "$total_tok")

# Threshold-colored ctx% (remaining), only once the API has reported it
if [ -n "$ctx" ]; then
  ctx_int=${ctx%.*}; ctx_int=${ctx_int:-0}
  if   [ "$ctx_int" -gt 50 ]; then ctx_color=$GREEN
  elif [ "$ctx_int" -ge 20 ]; then ctx_color=$YELLOW
  else                              ctx_color=$RED
  fi
fi

# Model badge: tier-colored name + qualifiers in dim parens, omz-style:
# "Fable 5 (max,fast,think)" — effort colored as the spend dial it is.
model_short="${model% (1M context)}"
case "$model" in
  *Fable*|*Mythos*) mcol=$M_FABLE ;;
  *Opus*)           mcol=$M_OPUS ;;
  *Sonnet*)         mcol=$M_SONNET ;;
  *Haiku*)          mcol=$M_HAIKU ;;
  *)                mcol=$YELLOW ;;
esac
case "$effort" in
  max)  ecol=$C_EFF_MAX ;;
  high) ecol=$C_EFF_HIGH ;;
  low)  ecol=$DIM ;;
  *)    ecol=$C_EFF_MED ;;
esac
printf -v model_col "${mcol}%s${RESET}" "$model_short"
qual=""
add_qual() { # $1=color $2=text
  local piece sep=""
  [ -n "$qual" ] && printf -v sep "${DIM},${RESET}"
  printf -v piece "$1%s${RESET}" "$2"
  qual="$qual$sep$piece"
}
[ -n "$effort" ]      && add_qual "$ecol" "$effort"
[ "$fast" = "true" ]  && add_qual "$C_FAST" "fast"
[ "$think" = "true" ] && add_qual "$DIM" "think"
[ -n "$qual" ] && printf -v model_col "%s ${DIM}(${RESET}%s${DIM})${RESET}" "$model_col" "$qual"

# Worktree: --worktree session name, else any linked-worktree name
wt_name="${wt:-$gwt}"

# Project state ─ gsd phase · openspec proposals · beads ready — built into
# $proj (real ESC bytes, printed with %s) and appended to row 1. Cheap file
# reads except bd, which is ~1s and served from a 120s background cache.
proj=""
root=""
[ -n "$branch_str" ] && root=$(git -C "$cwd" rev-parse --show-toplevel 2>/dev/null)
[ -z "$root" ] && root="$cwd"
cache_dir="$HOME/.cache/claude-statusline"
mkdir -p "$cache_dir" 2>/dev/null
key=$(printf '%s' "$root" | cksum); key=${key%% *}

# GSD: phase + status glyph + plan progress from STATE.md frontmatter
if [ -f "$root/.planning/STATE.md" ]; then
  read -r g_phase g_status g_done g_total < <(awk -F': ' '
    NR>30 {exit}
    {gsub(/^[ \t]+/, "", $1)}
    $1=="current_phase"   {p=$2}
    $1=="status"          {s=$2}
    $1=="completed_plans" {c=$2}
    $1=="total_plans"     {t=$2}
    END {print (p!=""?p:"-"), (s!=""?s:"-"), (c!=""?c:0), (t!=""?t:0)}
  ' "$root/.planning/STATE.md")
  case "$g_status" in
    executing) g_glyph="▶"; g_color=$GREEN ;;
    complete*) g_glyph="✓"; g_color=$DIM ;;
    blocked*)  g_glyph="✗"; g_color=$RED ;;
    *)         g_glyph="◆"; g_color=$YELLOW ;;
  esac
  printf -v proj "${g_color}gsd:%s %s${RESET}" "$g_phase" "$g_glyph"
  [ "$g_total" -gt 0 ] 2>/dev/null && printf -v proj "%s ${DIM}%s/%s${RESET}" "$proj" "$g_done" "$g_total"
  # Paused work waiting to be resumed (written by pause-work, eaten by resume)
  [ -f "$root/.planning/HANDOFF.md" ] && printf -v proj "%s ${C_HANDOFF}handoff!${RESET}" "$proj"
fi

# OpenSpec: active proposals split into not-started vs in-flight (any [x] in
# tasks.md = in-flight); "new" goes red at 3+ — the em fan-out threshold
if [ -d "$root/openspec/changes" ]; then
  os_new=0; os_wip=0
  for d in "$root/openspec/changes"/*/; do
    [ -d "$d" ] || continue
    case "$d" in */archive/) continue ;; esac
    if [ -f "${d}tasks.md" ] && grep -q '\[x\]' "${d}tasks.md" 2>/dev/null; then
      os_wip=$((os_wip+1))
    else
      os_new=$((os_new+1))
    fi
  done
  if [ $((os_new + os_wip)) -gt 0 ]; then
    printf -v proj "%s  ${DIM}os${RESET}" "$proj"
    if [ "$os_new" -gt 0 ]; then
      os_color=$GREEN; [ "$os_new" -ge 3 ] && os_color=$RED
      printf -v proj "%s ${os_color}new:%s${RESET}" "$proj" "$os_new"
    fi
    [ "$os_wip" -gt 0 ] && printf -v proj "%s ${YELLOW}wip:%s${RESET}" "$proj" "$os_wip"
  fi
fi

# Beads: ready / in-progress / blocked from `bd stats`, cached (bd is too
# slow to run inline every refresh; cache holds "ready wip blocked")
if [ -d "$root/.beads" ] && command -v bd >/dev/null 2>&1; then
  cache="$cache_dir/bds-$key"
  bd_rdy=""; bd_wip=""; bd_blk=""
  age=999999
  if [ -f "$cache" ]; then
    read -r bd_rdy bd_wip bd_blk < "$cache"
    age=$(( now - $(stat -f %m "$cache" 2>/dev/null || echo 0) ))
  fi
  if [ "$age" -ge 120 ]; then
    ( cd "$root" && bd stats --json 2>/dev/null \
        | jq -r '.summary | "\(.ready_issues) \(.in_progress_issues) \(.blocked_issues)"' \
        > "$cache.$$" 2>/dev/null && mv -f "$cache.$$" "$cache" || rm -f "$cache.$$" ) >/dev/null 2>&1 &
  fi
  case "$bd_rdy" in ''|*[!0-9]*) bd_rdy="" ;; esac  # first run / junk cache
  if [ -n "$bd_rdy" ] && [ $((bd_rdy + ${bd_wip:-0} + ${bd_blk:-0})) -gt 0 ]; then
    printf -v proj "%s  ${DIM}bd${RESET}" "$proj"
    [ "$bd_rdy" -gt 0 ]        && printf -v proj "%s ${CYAN}ready:%s${RESET}" "$proj" "$bd_rdy"
    [ "${bd_wip:-0}" -gt 0 ] 2>/dev/null && printf -v proj "%s ${YELLOW}wip:%s${RESET}" "$proj" "$bd_wip"
    [ "${bd_blk:-0}" -gt 0 ] 2>/dev/null && printf -v proj "%s ${RED}blocked:%s${RESET}" "$proj" "$bd_blk"
    # ~ = serving a stale cache while a refresh runs in the background
    [ "$age" -ge 120 ] && printf -v proj "%s${DIM}~${RESET}" "$proj"
  fi
fi

# CI status for the open PR: cached `gh pr checks` rollup (fail > pending > pass)
ci_state=""; ci_stale=""
if [ -n "$pr_num" ] && command -v gh >/dev/null 2>&1; then
  ci_cache="$cache_dir/ci-$key-$pr_num"
  ci_age=999999
  if [ -f "$ci_cache" ]; then
    ci_state=$(<"$ci_cache")
    ci_age=$(( now - $(stat -f %m "$ci_cache" 2>/dev/null || echo 0) ))
    [ "$ci_age" -ge 120 ] && ci_stale="~"
  fi
  if [ "$ci_age" -ge 120 ]; then
    ( cd "$root" && gh pr checks "$pr_num" --json bucket 2>/dev/null \
        | jq -r 'if length==0 then "none"
                 elif any(.[]; .bucket=="fail") then "fail"
                 elif any(.[]; .bucket=="pending") then "pending"
                 else "pass" end' > "$ci_cache.$$" 2>/dev/null \
        && mv -f "$ci_cache.$$" "$ci_cache" || rm -f "$ci_cache.$$" ) >/dev/null 2>&1 &
  fi
fi

# ── Row 1: place ─ path (branch) ⎇worktree #PR ci @session … up:/cost right ──
row1_left() {
  if [ -n "$short_cwd" ]; then
    printf "${C_PATH}%s${RESET}" "$(link "file://$cwd" "$short_cwd")"
  fi
  if [ -n "$branch_str" ]; then
    if [ -n "$repo_host" ] && [ -n "$branch" ] && [ "$branch" != "-" ]; then
      printf " ${DIM}(${RESET}%s${DIM})${RESET}" "$(link "https://$repo_host/$repo_owner/$repo_name/tree/$branch" "$branch_str")"
    else
      printf " ${DIM}(${RESET}%s${DIM})${RESET}" "$branch_str"
    fi
  fi
  [ -n "$wt_name" ]    && printf " ${C_WT}⎇ %s${RESET}" "$wt_name"
  if [ -n "$pr_num" ]; then
    case "$pr_state" in
      approved)          pr_icon="✓"; pr_color=$GREEN ;;
      changes_requested) pr_icon="✗"; pr_color=$RED ;;
      draft)             pr_icon="◐"; pr_color=$DIM ;;
      pending)           pr_icon="●"; pr_color=$YELLOW ;;
      *)                 pr_icon="";  pr_color=$MAGENTA ;;
    esac
    printf " ${pr_color}%s${RESET}" "$(link "$pr_url" "#$pr_num$pr_icon")"
    case "$ci_state" in
      fail)    printf " ${RED}ci:x%s${RESET}" "$ci_stale" ;;
      pending) printf " ${YELLOW}ci:~%s${RESET}" "$ci_stale" ;;
      pass)    printf " ${GREEN}ci:ok%s${RESET}" "$ci_stale" ;;
    esac
  fi
  [ -n "$sess_name" ] && printf " ${C_SESS}@%s${RESET}" "$sess_name"
}
r1_col=""; r1_txt=""
dur_str=$(fmt_span $(( dur_ms / 1000 )))
if [ -n "$dur_str" ]; then
  r1_txt="up:$dur_str"
  printf -v r1_col "${DIM}up:%s${RESET}" "$dur_str"
  # Busy ratio: api_duration / wall-clock duration = % of the session the
  # model spent working (thinking/generating/tools) vs idle waiting on me.
  # ~90%+ = autonomous grind; ~20% = mostly me reading/typing between turns.
  if [ "$api_ms" -gt 0 ] && [ "$dur_ms" -gt 0 ]; then
    api_pct=$(( api_ms * 100 / dur_ms ))
    r1_txt="$r1_txt api:$api_pct%"
    printf -v r1_col "%s ${DIM}api:%s%%${RESET}" "$r1_col" "$api_pct"
  fi
fi
if [ -n "$cost_usd" ]; then
  cost_str=$(printf '$%.2f' "$cost_usd" 2>/dev/null)
  if [ -n "$cost_str" ] && [ "$cost_str" != '$0.00' ]; then
    # Cost is a status, not trivia: dim <$10, yellow <$30, orange above —
    # plus burn rate once the session is >5 min old
    cost_int=${cost_usd%%.*}; cost_int=${cost_int:-0}
    ccol=$DIM
    if   [ "$cost_int" -ge 30 ] 2>/dev/null; then ccol=$C_COST_HOT
    elif [ "$cost_int" -ge 10 ] 2>/dev/null; then ccol=$C_COST_WARN
    fi
    rate_str=""
    if [ "$dur_ms" -ge 300000 ]; then
      cents=${cost_str#\$}; cents=${cents/./}
      rate=$(( cents * 36000 / dur_ms ))
      [ "$rate" -ge 1 ] && rate_str="~\$$rate/h"
    fi
    r1_txt="${r1_txt:+$r1_txt }$cost_str${rate_str:+($rate_str)}"
    printf -v r1_col "%s${ccol}%s${RESET}" "${r1_col:+$r1_col }" "$cost_str"
    [ -n "$rate_str" ] && printf -v r1_col "%s${DIM}(%s)${RESET}" "$r1_col" "$rate_str"
  fi
fi
print_row "$(row1_left)" "$r1_col" "$r1_txt"

# ── Row 2: session ─ model tokens ctx limits [style] … diffstat right-aligned ──
row2_left() {
  [ -n "$model_short" ] && printf '%s' "$model_col"
  # ctx as used/window (free%) — one unambiguous segment instead of tok + ctx%
  if [ -n "$ctx" ] && [ "$ctx_size" -gt 0 ] 2>/dev/null; then
    used_tok=$(( ctx_size - ctx_size * ctx_int / 100 ))
    printf " ${DIM}ctx:${RESET}${ctx_color}%s${RESET}${DIM}/%s${RESET}" \
      "$(humanize "$used_tok")" "$(humanize "$ctx_size")"
    printf " ${DIM}(${RESET}${ctx_color}%s%%${RESET}${DIM} free)${RESET}" "$ctx_int"
  elif [ "$total_tok" -gt 0 ]; then
    printf " ${DIM}%s tok${RESET}" "$tok_str"
  fi
  [ "$x200k" = "true" ] && printf " ${RED}!200k${RESET}"
  rl_seg "5h" "$rl5" "$rl5_reset" 1800 18000
  rl_seg "7d" "$rl7" "$rl7_reset" 43200 604800
  # Prompt-cache hit rate of the LAST request: cache_read / total input.
  # Dim while healthy (>=80%), yellow below, red <50% — a cold cache means
  # the request paid full price (~10x) instead of reading cached prefix.
  cache_tot=$(( cur_in + cache_rd + cache_cr ))
  if [ "$cache_tot" -gt 0 ]; then
    cache_pct=$(( cache_rd * 100 / cache_tot ))
    cc=$DIM
    if   [ "$cache_pct" -lt 50 ]; then cc=$RED
    elif [ "$cache_pct" -lt 80 ]; then cc=$YELLOW
    fi
    printf " ${cc}cache:%s%%${RESET}" "$cache_pct"
  fi
  [ -n "$style" ] && [ "$style" != "default" ] && printf " ${MAGENTA}[%s]${RESET}" "$style"
}
r2_col=""; r2_txt=""
if [ "$lines_add" -gt 0 ] || [ "$lines_rem" -gt 0 ]; then
  printf -v r2_col "${DIM}lines${RESET} ${GREEN}+%s${RESET}${DIM}/${RESET}${RED}-%s${RESET}" "$lines_add" "$lines_rem"
  r2_txt="lines +$lines_add/-$lines_rem"
fi
print_row "$(row2_left)" "$r2_col" "$r2_txt"

# ── Row 3: project state (only when the repo has any) ──
proj="${proj# }"
[ -n "$proj" ] && printf '%s\n' "$proj"
exit 0
Make it executable:
chmod +x ~/.claude/statusline-command.shAnd point ~/.claude/settings.json at it — one addition here versus the first post: refreshInterval so the line re-renders every few seconds even when you’re not typing, which matters now that rows carry live state like CI checks and rate-limit countdowns that change on their own.
{
  "statusLine": {
    "type": "command",
    "command": "bash ~/.claude/statusline-command.sh",
    "refreshInterval": 5
  }
}
Sanity-check it the same way as the first post — pipe a sample payload through and confirm you get colored output back before restarting your session:
echo '{"cwd":"'"$HOME"'/test","model":{"display_name":"Sonnet 5"},"context_window":{"remaining_percentage":85,"context_window_size":1000000},"cost":{"total_lines_added":10,"total_lines_removed":5,"total_duration_ms":400000,"total_cost_usd":1.2},"rate_limits":{"five_hour":{"used_percentage":3,"resets_at":9999999999}}}' | bash ~/.claude/statusline-command.shWhere to start if you’re upgrading your own line
You don’t need all nine of these at once. If you’re working from the original post’s script, here’s the order I’d add them in, roughly by effort-to-payoff:
- The debug dump (five minutes, zero risk) — do this first regardless of what else you add, so every field after it is built against real payloads instead of guesses.
- Cache hit-rate — a straight swap for the old
cc:/cr:fields, same data, better math. - PR review-state + CI, if you ever have more than one Claude Code session open on branches with PRs out.
- Rate-limit pacing, if you’re on a plan with rolling limits and have ever hit the wall by surprise.
- The three-row split with a right-aligned tail, once your one-liner starts wrapping or you’re deleting fields to make room for new ones.
- A project-state row, built around whichever tracker or planning tool you actually check by hand most often — not necessarily GSD/OpenSpec/Beads.
The rule, restated for a row
The first post’s bar was: does this field, looked at right now, change a decision you’re about to make? That still holds per-field, and it’s still the right first filter to apply to anything you’re thinking about adding. What’s new at three rows is a second bar, applied per-row: does this row, as a whole, disappear when it has nothing to say?
Row 3 is the clearest example on my line — most renders, on most repos, it’s not there, and that’s correct. A statusline that always shows every row you’ve ever configured stops being a cockpit indicator and becomes wallpaper you stop reading. Whatever you build, make the empty state as deliberate as the full one — if a row can’t earn a clean “nothing to show” most of the time, it doesn’t belong on the line yet.
The JSON payload will keep growing, and you’ll keep finding project state worth reading off disk that has nothing to do with it. When you hit that point, don’t reach for a new field on an existing row first — ask whether it’s actually a new row, or a reason one of your current rows should learn to disappear more often.
Get it
The whole thing lives in agent-statusline — namespaced modules, a build.sh that flattens them into the single fork-free file Claude Code runs, ShellCheck-clean CI, and versioned releases.
brew install tokdio/tap/agent-statuslinebrew info agent-statusline prints the exact statusLine block to paste into ~/.claude/settings.json. No Homebrew? Curl the prebuilt script instead.
Try the three-row layout interactively in the Statusline Playground →

Keep reading

Agent Config, Installed Tool, and Live Behavior Are Three Different Things
A model or workflow can be correct in source and still be absent from the installed runtime. Verify each layer before claiming it works.
Running Independent AI Research Trials
Two isolated research environments can work from the same source material while keeping their analysis independent and reviewable.
Two Codex Accounts, One Session History
Use CODEX_HOME for a second Codex login, then share only the session files you need to resume by ID. Here is the setup I use, what stays separate, and what I actually verified.
What did you take away?
Thoughts, pushback, or a story of your own? Drop a reply below — I read every one.
Comments are powered by Disqus. By posting you agree to theirterms.