Your Statusline is the Cheapest Feedback Loop in Agentic Coding
Most teams using Claude Code, Cursor, or Aider leave the statusline at default. It's a one-line strip of pixels that costs you nothing, sees zero tokens, and can change every decision you make during a session.
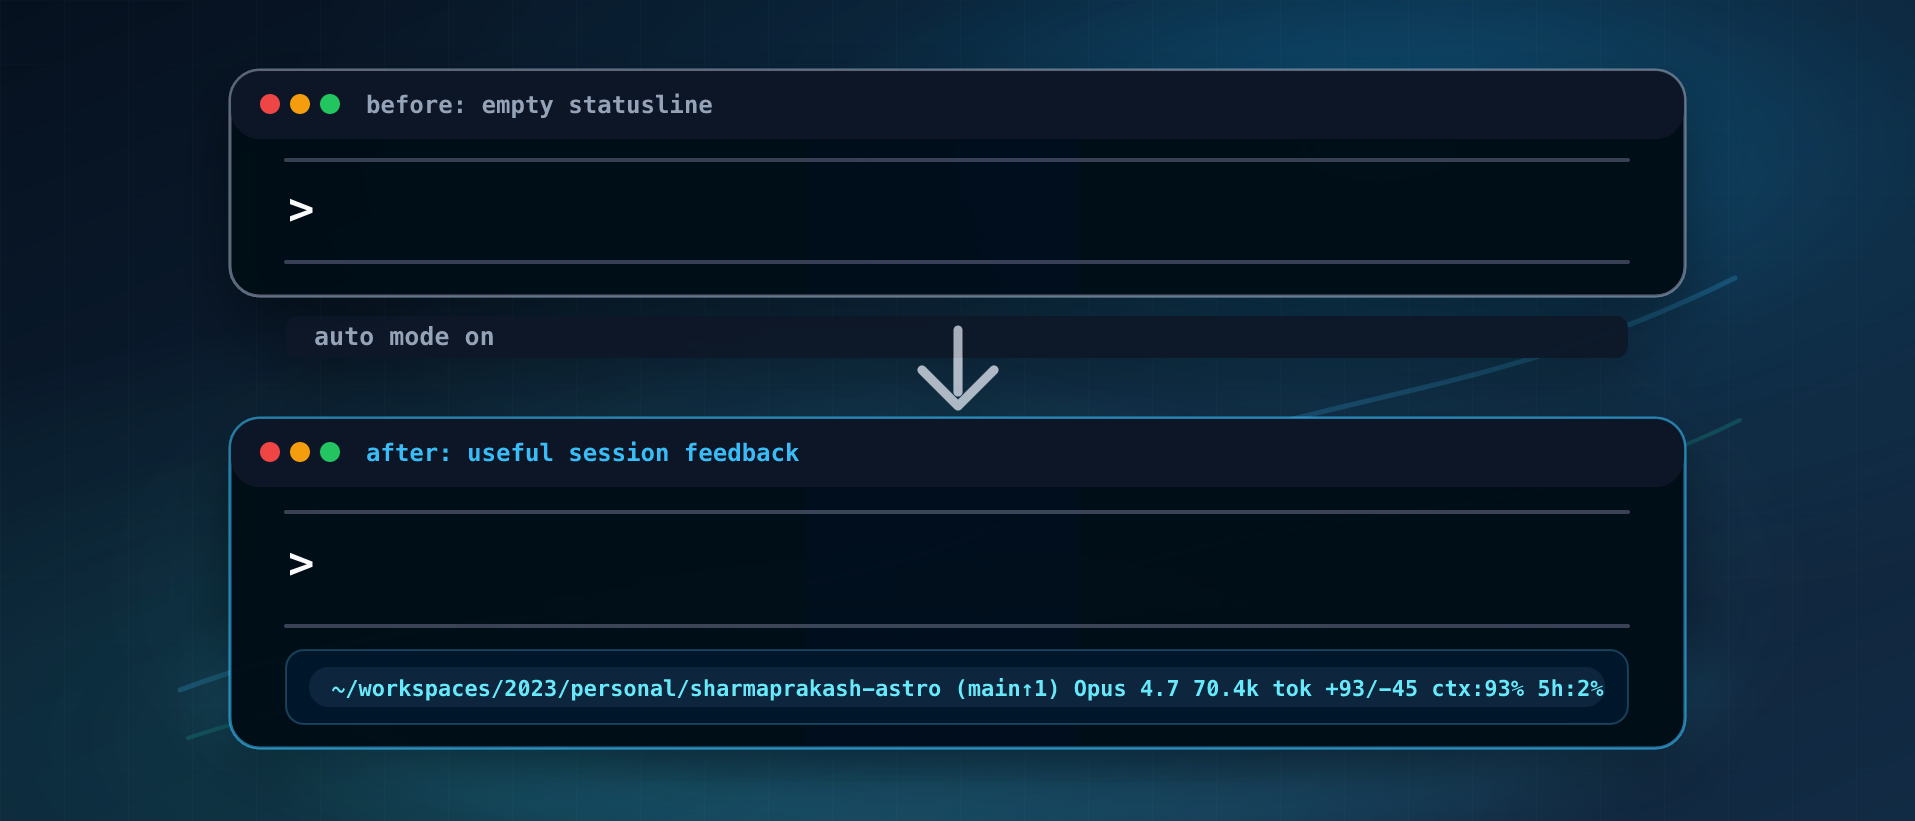
Most agentic CLIs ship with a statusline slot — the strip of text just below your input box, between the prompt and the mode-hint footer.
Here’s what Claude Code shows out of the box, with no configuration:
──────────────────────────────────────────────────────────────────
❯
──────────────────────────────────────────────────────────────────
⏵⏵ auto mode on (shift+tab to cycle) · ← for agents
That’s it. The slot is empty. No model name, no path, no context indicator. The CLI hands you a blank canvas and waits for you to fill it.
Now here’s the same line on my machine after twenty-five minutes of setup:
~/workspaces/2023/personal/sharmaprakash-astro (main↑1) Opus 4.7 70.4k tok +93/-45 ctx:93% 5h:2%
⏵⏵ auto mode on (shift+tab to cycle)
Seven fields, one line, zero token cost — and each field changes a decision I make during the session.
This post is about why the statusline is the most underused configuration surface in agentic coding, what to put in it, and a few patterns the community has converged on.
Update, August 2026: the script below is where I started. It’s since grown into a three-row layout with clickable branch/PR links, rate-limit pacing, and a project-state row — see Statusline v2: Three Rows, Clickable Links, and a Live Project HUD for what changed and why. The fundamentals here — what the statusline is, the fork-count discipline, the
$HOMEcollapse trap — still stand and aren’t repeated there.
What the statusline actually is
A clarification first, because this confuses people: the statusline runs on your machine and the model never sees it.
It is a terminal UI element rendered by the Claude Code CLI (and analogues in Cursor, Aider, opencode, and others). The CLI calls a shell command, captures its stdout, and paints the output into the chrome just below your input box. Token cost: zero. Context cost: zero. The model doesn’t know it exists.
This is the opposite of a SessionStart hook — which also runs a shell command, but whose output gets injected into the prompt as a <system-reminder>. Different layer entirely. Different cost. People conflate the two because both live in .claude/ and both are “scripts that produce text,” but the statusline is purely for you, the human at the keyboard.
So when you change the statusline, you are tuning your own feedback loop. Nothing else.
What the default statusline gives you
Nothing. It’s a deliberate non-decision: Claude Code reserves the line and lets you decide what belongs there.
That’s actually the right call from a tool-design perspective. Anything they ship as default would be wrong for half their users — a senior engineer on a 1M-context Opus session has different concerns than someone trying Claude Code for the first time. So they ship empty, and the people who care enough to configure it get exactly what they want.
The cost of that decision is that most users never realise the slot exists. They open Claude Code, see no statusline, assume there isn’t one, and never look in settings.json. Six months in, they’re still flying blind on context %, model toggles, and session token spend.
The other thing to know about the empty default: the CLI is still piping a full JSON payload to something on every render — there’s just no command consuming it. Wire up a script and you tap into a dashboard’s worth of data that’s been sitting unused.
Why customize at all
Three reasons.
1. The slot is otherwise wasted
An empty line below your input box is screen real estate the CLI has already reserved. Whether you fill it or not, it’s there. Leaving it blank doesn’t reclaim space — it just means you forfeit the signal you could be getting.
2. The CLI exposes data nothing else surfaces
Every render, Claude Code pipes a JSON payload into your statusline script via stdin. Most of it is unused by the default. Here’s what’s actually in there (I confirmed this by dumping the payload to a file mid-session):
{
  "session_id": "...",
  "cwd": "...",
  "model": { "id": "claude-opus-4-7[1m]", "display_name": "Opus 4.7 (1M context)" },
  "workspace": {
    "current_dir": "...",
    "project_dir": "...",
    "repo": { "host": "github.com", "owner": "...", "name": "..." }
  },
  "output_style": { "name": "default" },
  "cost": {
    "total_cost_usd": 1.33,
    "total_duration_ms": 1099354,
    "total_api_duration_ms": 204723,
    "total_lines_added": 29,
    "total_lines_removed": 26
  },
  "context_window": {
    "total_input_tokens": 63884,
    "total_output_tokens": 143,
    "context_window_size": 1000000,
    "used_percentage": 6,
    "remaining_percentage": 94,
    "current_usage": {
      "input_tokens": 8500,
      "output_tokens": 1200,
      "cache_creation_input_tokens": 5000,
      "cache_read_input_tokens": 52000
    }
  },
  "rate_limits": {
    "five_hour":  { "used_percentage": 1,  "resets_at": ... },
    "seven_day":  { "used_percentage": 18, "resets_at": ... }
  },
  "exceeds_200k_tokens": false,
  "fast_mode": false,
  "thinking": { "enabled": true }
}
That’s a dashboard’s worth of data. The default shows you zero fields from it. Choose the right ones and the empty line becomes a flight instrument.
3. Every render is free
Unlike a hook, the statusline doesn’t burn tokens. Make it as informative as you want, within reason. The only cost is the milliseconds your shell takes to render — and we’ll come back to that.
The statusline I run now
Here it is again:
~/workspaces/2023/personal/sharmaprakash-astro (main↑1) Opus 4.7 70.4k tok +93/-45 ctx:93% cc:12k|cr:840k 5h:2%Eight fields. Each earns its place by changing a decision I make during the session.
~/workspaces/... — cwd with $HOME collapsed
I keep this in because at any given moment I might be running three Claude sessions in different repos, and “which one am I in?” is occasionally a real question. $HOME collapses to ~/ for five characters back.
(main↑1) — branch plus state
The branch name carries state markers I’d otherwise have to type git status to see:
*— there are uncommitted changes↑N— N commits ahead of upstream↓N— N commits behind upstream
This is the single highest-leverage field I added. Without it I’d forget to commit for a full session, then wonder where two hours of agent work went when context dies. The dirty marker is a constant low-grade nudge: commit before you compact. The ahead/behind markers tell me when I should push, or when I’m about to start work on a stale branch.
I get all three from a single git status --porcelain=v2 --branch call, parsed with one awk.
Opus 4.7 — model name, trimmed
The CLI’s JSON gives me Opus 4.7 (1M context) as the display name. I strip (1M context) because I’m always on the 1M-context build and the extra eight characters don’t tell me anything I don’t already know.
Where the model name does matter: when I toggle between Opus and Sonnet via /fast or /model. A glance at this field confirms which one I’m paying for right now. If you don’t toggle, you can drop the field entirely.
70.4k tok — total tokens this session
The single most-asked question when I’m sharing work with teammates is “how many tokens has this session used?” — for cost attribution, for plan-tier budgeting, or just for context on a particularly long session.
Claude Code exposes context_window.total_input_tokens and total_output_tokens. I sum them and humanize: < 1000 shows raw, 1k–999k shows like 70.4k, ≥ 1M shows like 1.2M. Bash integer math, no bc fork.
Some people prefer cost.total_cost_usd here instead — $1.33. Both are valid. Pick whichever matches how your team talks about usage. I land on tokens because that’s the unit my colleagues track.
+93/-45 — lines added/removed by the agent
This one is new to me and has changed my behaviour the most.
cost.total_lines_added and total_lines_removed count diff lines applied by the agent during this session. Two minutes into a “small refactor” task, I look down and see +847/-322 — and I know something has gone off the rails before I review the diff. The number is a magnitude check.
Counter-anecdote: I asked for a “tiny CSS tweak” last week, and the statusline showed +8/-3 when the agent reported done. Reassuring before I even opened git diff.
It’s not a quality signal — agents can ship a busted 12-line change. But it is a scope signal, and scope is what runs away during agentic sessions.
ctx:93% — context remaining, threshold-coloured
Context-remaining percentage, but coloured:
- Green > 50% — you’re fine, keep going.
- Yellow 20–50% — start thinking about a
/compact. - Red < 20% — stop accepting new work, finish what you have, then compact or fresh-session.
Turning a number you have to read into a colour you notice is the cheapest UX upgrade in the script. I went from regularly hitting ctx exhaustion mid-task to never hitting it.
cc:12k|cr:840k — cache creation vs cache reads
Every turn Claude processes has two kinds of token cost: cache creation (cc:) tokens that are new context being written to the cache — expensive, billed at ~125% of input rate — and cache read (cr:) tokens that are reused from cache — cheap, billed at ~10% of input rate.
The ratio between them is a live health signal for your session:
- Green
cc:(ratio > 20×) — the cache is working well. Most tokens are cheap reads. - Yellow
cc:(5–20×) — moderate cache busting. Something changed mid-session. - Red
cc:(< 5×) — cache is being invalidated often. Common causes: switching models, editingCLAUDE.mdmid-session, adding/removing MCP servers. Fix the cause and the colour goes green.
A healthy session has one large cc: spike at the start (building initial context), then all subsequent turns show low cc: and high cr:. If you see large cc: on every turn, you’re paying full price each time.
The field only appears when there’s actual cache activity — it doesn’t clutter the line at session start.
5h:2% — five-hour rate-limit usage
Claude’s plan tiers have rolling rate limits (5-hour and 7-day windows). rate_limits.five_hour.used_percentage tells you where you sit in the current 5-hour bucket. If it’s at 87%, you know to ration the next big task or wait for the reset.
I show it only when non-zero so it doesn’t take real estate on the first session of the day.
What I deliberately left out
The temptation is to cram every JSON field into the statusline. Most of it shouldn’t be there.
session_id— useless to a human, useful to a log scraper. Put it in a hook log file, not the statusline.total_cost_usdalongside tokens — you only need one of cost or tokens, not both. Two numbers competing for the same attention slot is one too many.exceeds_200k_tokens— implied byctx:%already.thinking.enabled/fast_mode— set once at session start, doesn’t change. Not statusline material.- Time-since-last-commit — interesting in theory, but it’s another
gitcall per render and overlaps with the dirty marker. The marker is enough nudge. - A timestamp — your terminal has a clock. Use your terminal’s clock.
The bar I use: does this field, looked at right now, change a decision I’m about to make? If no, cut it.
Patterns the community has converged on
A few things I see across ccstatusline, claude-code-statusline, and various dotfiles repos:
Threshold colouring
Almost universal for ctx:%. Some configs also threshold the rate-limit field (yellow > 70%, red > 90%) and the lines-changed field (yellow > 200, red > 500). The principle: numbers without colour are read; numbers with threshold colour are noticed.
Burn rate
$cost / (total_duration_ms / 3600000) = dollars per hour. Some setups display it as $3.20/h. Useful for long sessions where the absolute cost is small but the trajectory matters.
Git status with worktree awareness
If you use git worktree heavily, configs add a (wt:branch-name) marker so you don’t accidentally commit to the wrong working copy. Claude Code’s JSON doesn’t expose worktree info directly, but git rev-parse --show-toplevel gives it cheap.
Stale-data indicator
Some setups show a small dot that turns red if the typecheck or lint last failed. Implemented by having a Stop hook write ~/.claude/last-typecheck.status and the statusline reading the file. Cheap. The agent sees nothing; you see a red dot until you fix it.
Mode / output-style
If you flip between Plan mode, default, and custom output styles, surfacing output_style.name in magenta brackets reminds you which lens the agent is currently using. Easy to forget you’re in plan mode and wonder why the agent isn’t writing code.
The “earn your character” rule
The most common piece of advice across all the community configs: every character in the statusline must earn its place. Aim for under ~80 characters. If a field hasn’t been useful in two weeks, drop it. The statusline is not a dashboard — it’s a one-line cockpit indicator.
Performance: forks per render
The statusline re-renders on most UI changes — keystrokes, tool calls, model responses. If your script forks five subprocesses per render, you’re spending real CPU.
A first-pass statusline script I wrote had ~5 forks per render: three jq calls, one whoami, one hostname, plus a sed and a git. The current one has two forks: one jq (returning all fields tab-separated, parsed by bash read), one git status (parsed by one awk). The rest is bash builtins.
The three rules of thumb that got me from five forks to two:
- One
jqcall, tab-separated output, parsed by bashread. Never calljqtwice for two fields from the same payload. - Bash parameter expansion instead of
sed/awkfor simple string ops.${var#prefix},${var%suffix},caseblocks — no fork. - Bash integer math instead of
bcfor humanizing numbers.$((total / 1000)).$(( (total / 100) % 10 ))kgives you70.4kwithout forking.
The full script below puts all three into practice — read it alongside this list and the patterns will jump out.
Two-fork render on a modern Mac is well under 20ms. You won’t see it. Five-fork render on a loaded machine can hit 60ms and you start to feel it during fast typing.
A note on ${var/#$HOME/~}
If you read another statusline tutorial, you’ve probably seen this pattern:
short_cwd="${cwd/#$HOME/~}"It looks elegant. In bash, it doesn’t work, because bash treats / in ${var/pattern/replacement} as a field separator. When $HOME expands to /Users/prakash, the / in the middle of the path breaks the substitution.
It does work in zsh, which is why a lot of zsh-using authors publish it as a bash snippet and never notice. The case form above is the portable fix. Took me ten minutes of debugging to find this.
Set it up yourself
Total time: about five minutes if you copy mine verbatim, twenty-five if you tweak it as you go.
There are only two files: the script that renders the line, and the settings.json block that tells Claude Code to call it.
Coming from Codex? Codex ships an interactive picker for the statusline — you arrow through options and it writes the config for you. Claude Code does not. The closest equivalent is the
/statuslineslash command, which launches thestatusline-setupagent: it reads your shellPS1and writes astatusLineblock into~/.claude/settings.jsonon your behalf. Past that, configuration is a manual edit ofsettings.jsonplus a script you control — which is what the rest of this section walks through. There is no GUI; the two paths are agent-driven setup (/statusline) or roll your own (below).
~/.claude/
├── statusline-command.sh    # the renderer
└── settings.json            # tells the CLI to run it
1. The script
Drop this in ~/.claude/statusline-command.sh. It reads the JSON payload from stdin, prints one ANSI-coloured line to stdout, exits 0 — that’s the entire CLI contract.
#!/bin/bash
input=$(cat)

# One jq call: all fields tab-separated
IFS=$'\t' read -r cwd model in_tok out_tok lines_add lines_rem ctx rl5 style cache_create cache_read < <(
  printf '%s' "$input" | jq -r '[
    .cwd // "",
    .model.display_name // "",
    .context_window.total_input_tokens // 0,
    .context_window.total_output_tokens // 0,
    .cost.total_lines_added // 0,
    .cost.total_lines_removed // 0,
    .context_window.remaining_percentage // 0,
    .rate_limits.five_hour.used_percentage // 0,
    .output_style.name // "",
    .context_window.current_usage.cache_creation_input_tokens // 0,
    .context_window.current_usage.cache_read_input_tokens // 0
  ] | @tsv' 2>/dev/null
)

# Colors
CYAN='\033[0;36m'; GREEN='\033[0;32m'; YELLOW='\033[0;33m'
RED='\033[0;31m';  MAGENTA='\033[0;35m'; DIM='\033[2m'; RESET='\033[0m'

# cwd: replace $HOME with ~
case "$cwd" in
  "$HOME")   short_cwd="~" ;;
  "$HOME"/*) short_cwd="~${cwd#$HOME}" ;;
  *)         short_cwd="$cwd" ;;
esac

# Git: branch + dirty + ahead/behind in ONE call, parsed with ONE awk
branch_str=""
if [ -n "$cwd" ] && { [ -d "$cwd/.git" ] || git -C "$cwd" rev-parse --git-dir >/dev/null 2>&1; }; then
  gs=$(git -C "$cwd" --no-optional-locks status --porcelain=v2 --branch 2>/dev/null)
  read -r branch ab_a ab_b dirty < <(awk '
    $2=="branch.head" {b=$3}
    $2=="branch.ab"   {a=$3; c=$4}
    !/^#/ && NF        {d=1}
    END {print (b?b:"-"), (a?a:"+0"), (c?c:"-0"), (d?1:0)}
  ' <<<"$gs")
  marks=""
  [ "$dirty" = "1" ]   && marks="${marks}*"
  [ "$ab_a" != "+0" ]  && marks="${marks}↑${ab_a#+}"
  [ "$ab_b" != "-0" ]  && marks="${marks}↓${ab_b#-}"
  branch_str="$branch"
  [ -n "$marks" ] && branch_str="$branch_str$marks"
fi

# Humanize tokens (bash integer math, no fork)
humanize() {
  local n=$1
  if   [ "$n" -ge 1000000 ]; then printf "%s.%sM" "$((n/1000000))" "$(( (n/100000)%10 ))"
  elif [ "$n" -ge 1000 ];    then printf "%s.%sk" "$((n/1000))"    "$(( (n/100)%10 ))"
  else printf "%s" "$n"
  fi
}

total_tok=$(( in_tok + out_tok ))
tok_str=$(humanize "$total_tok")

# Cache metrics: cc = creation (expensive), cr = reads (cheap)
cache_create=${cache_create:-0}; cache_read=${cache_read:-0}
cc_str=$(humanize "$cache_create")
cr_str=$(humanize "$cache_read")
if [ "$cache_read" -gt 0 ] && [ "$cache_create" -gt 0 ]; then
  ratio=$(( cache_read / cache_create ))
else
  ratio=99
fi

# Threshold-colored ctx%
ctx_int=${ctx%.*}; ctx_int=${ctx_int:-0}
if   [ "$ctx_int" -gt 50 ]; then ctx_color=$GREEN
elif [ "$ctx_int" -ge 20 ]; then ctx_color=$YELLOW
else                              ctx_color=$RED
fi

# Strip "(1M context)" noise from model display name
model_short="${model% (1M context)}"

# Render
[ -n "$short_cwd" ]  && printf "${CYAN}%s${RESET}" "$short_cwd"
[ -n "$branch_str" ] && printf " ${GREEN}(%s)${RESET}" "$branch_str"
[ -n "$model_short" ] && printf " ${YELLOW}%s${RESET}" "$model_short"
[ "$total_tok" -gt 0 ] && printf " ${DIM}%s tok${RESET}" "$tok_str"
if [ "$lines_add" -gt 0 ] || [ "$lines_rem" -gt 0 ]; then
  printf " ${GREEN}+%s${RESET}${DIM}/${RESET}${RED}-%s${RESET}" "$lines_add" "$lines_rem"
fi
[ -n "$ctx" ] && printf " ${ctx_color}ctx:%.0f%%${RESET}" "$ctx"
# Cache: cc (creation=expensive) coloured by ratio; cr (reads=cheap) dimmed
if [ "$cache_create" -gt 0 ] || [ "$cache_read" -gt 0 ]; then
  if   [ "$ratio" -lt 5 ];  then cc_color=$RED
  elif [ "$ratio" -lt 20 ]; then cc_color=$YELLOW
  else                           cc_color=$GREEN
  fi
  printf " ${cc_color}cc:%s${RESET}${DIM}|cr:%s${RESET}" "$cc_str" "$cr_str"
fi
[ "$rl5" -gt 0 ] 2>/dev/null && printf " ${DIM}5h:%s%%${RESET}" "$rl5"
[ -n "$style" ] && [ "$style" != "default" ] && printf " ${MAGENTA}[%s]${RESET}" "$style"
exit 0
Make it executable:
chmod +x ~/.claude/statusline-command.sh2. The settings block
Tell Claude Code to call the script. Open (or create) ~/.claude/settings.json and add a statusLine block:
{
  "statusLine": {
    "type": "command",
    "command": "bash ~/.claude/statusline-command.sh"
  }
}
If you already have a settings.json, merge the statusLine key in — don’t replace the file.
3. Verify
Open a new Claude Code session in any git repo. You should see the line render below your input box. If it’s blank, sanity-check:
bash ~/.claude/statusline-command.sh < /dev/null— should print nothing and exit 0 cleanly (nojq: command not found, no syntax error).- Pipe a sample payload through it to see a full render:
echo '{"cwd":"'"$HOME"'/test","model":{"display_name":"Opus 4.7"},"context_window":{"total_input_tokens":50000,"total_output_tokens":1000,"remaining_percentage":85},"cost":{"total_lines_added":10,"total_lines_removed":5},"rate_limits":{"five_hour":{"used_percentage":3}}}' | bash ~/.claude/statusline-command.shIf that prints a coloured line, the script is fine and the CLI side just needs a session restart.
4. Make it yours
The fields above are what I look at. Yours should be different. The bar from earlier still applies: does this field, looked at right now, change a decision I’m about to make? If you never toggle models, drop the model field. If you never push, drop the ↑N marker. If you’re on a fixed plan with no rate limits, drop 5h:. Every character earns its place.
I keep the script in my dotfiles repo so it survives machine setup. The fields I show evolve based on what I’m currently asking myself during sessions — last quarter I had time-since-last-commit instead of lines-changed; this quarter the magnitude signal turned out to be more useful, so I swapped.
Extending it: hook-driven fields
The JSON payload from Claude Code is what you get for free. Anything else you want on the statusline you provide yourself — and the cheapest pipe is a hook that writes a file, a statusline that reads it.
The canonical example: a red dot when your last typecheck failed.
1. The hook
Stop hooks fire when Claude finishes a turn. Run pnpm check (or tsc --noEmit, or your linter) and write the exit status to a known path. ~/.claude/settings.json:
{
  "hooks": {
    "Stop": [
      {
        "matcher": "",
        "hooks": [
          {
            "type": "command",
            "command": "cd \"$CLAUDE_PROJECT_DIR\" && pnpm -s check >/dev/null 2>&1; echo $? > \"$CLAUDE_PROJECT_DIR/.claude/last-typecheck.status\""
          }
        ]
      }
    ]
  }
}
Two things to note:
- The command runs detached from your terminal, so it can’t print. The file is the only side channel.
$CLAUDE_PROJECT_DIRis set by Claude Code per session. Scoping the status file under the project keeps multi-repo sessions from clobbering each other.
2. The statusline read
Append to the renderer from earlier:
# Typecheck indicator (red dot = last check failed, dim dot = passed, blank = never run)
tc_file="$cwd/.claude/last-typecheck.status"
if [ -f "$tc_file" ]; then
  tc_status=$(< "$tc_file")
  if   [ "$tc_status" = "0" ]; then printf " ${DIM}●${RESET}"
  else                              printf " ${RED}●${RESET}"
  fi
fi
One file read per render — same cost class as a bash builtin. No fork.
3. Why this pattern generalises
Anything you can compute between turns goes through this same pipe:
- Test status — run
pnpm test --bailinStop, writepass/fail, render aT:indicator. - Bundle size delta — run a size check, write the bytes delta from
main, render+12kBin red if it crossed a threshold. - PR review-comment count —
gh pr view --json reviewDecision,commentsin a periodic background job, write the unread count, renderpr:3. - Branch age —
git log -1 --format=%ctwritten by aSessionStarthook, rendered asbranch:4d.
The agent sees none of it. You see all of it. The hook does the work exactly when work changed, and the statusline does the cheap part — display the result on every render.
The principle worth internalising: the hook is the producer, the statusline is the consumer, the file is the queue. Once you see it, half of the things you wished the JSON payload contained become things you can just write yourself.
When to revisit your statusline
- You keep asking yourself the same question mid-session. Surface it.
- A field hasn’t been useful in two weeks. Cut it.
- You start running multi-window cmux sessions. Add a session label or workspace name so you can tell two terminals apart.
- The CLI ships a new field in the JSON payload. They add fields quietly —
rate_limitswasn’t there a few versions ago. Dump the JSON to a file once a month and skim.
Closing thought
The statusline is the only piece of your agentic-coding setup that gives you direct, real-time, zero-cost feedback about the session you’re in. The model can’t see it. It can’t bias the agent. It costs nothing to render.
Most teams leave it at default — and the default is empty. The slot sits unused, the JSON payload streams to nowhere, and you fly the session blind on the signals that matter most: branch state, token spend, diff magnitude, context budget.
Twenty-five minutes of bash, and your one-line cockpit tells you exactly what you ask of it: where you are, what state your branch is in, which model is on the meter, how much you’ve spent in tokens, how big the agent’s diff has grown, how much context you have left, and where you sit against your rate limit.
It’s the cheapest feedback loop in your stack. Build it once.
Don’t want to build it? Install it
Everything above has since been extracted into its own repo — agent-statusline — namespaced modules, a build.sh that flattens them into the single fork-free file Claude Code actually runs, ShellCheck-clean CI, and versioned releases.
Homebrew — puts agent-statusline on your PATH, no ~/.claude path to remember:
brew install tokdio/tap/agent-statuslinebrew info agent-statusline prints the exact statusLine block to paste into ~/.claude/settings.json.
Or curl the prebuilt script directly:
curl -fsSL "https://github.com/poudelprakash/agent-statusline/releases/latest/download/statusline-command.sh?utm_source=sharmaprakash-blog&utm_medium=referral&utm_campaign=statusline-v1&utm_content=curl-oneliner" \
  -o ~/.claude/statusline-command.sh
chmod +x ~/.claude/statusline-command.sh
For what the current three-row layout does with those fields, see Statusline v2: Three Rows, Clickable Links, and a Live Project HUD.
Compose and preview the statusline described here in the Statusline Playground →

Keep reading

Agent Config, Installed Tool, and Live Behavior Are Three Different Things
A model or workflow can be correct in source and still be absent from the installed runtime. Verify each layer before claiming it works.
Running Independent AI Research Trials
Two isolated research environments can work from the same source material while keeping their analysis independent and reviewable.
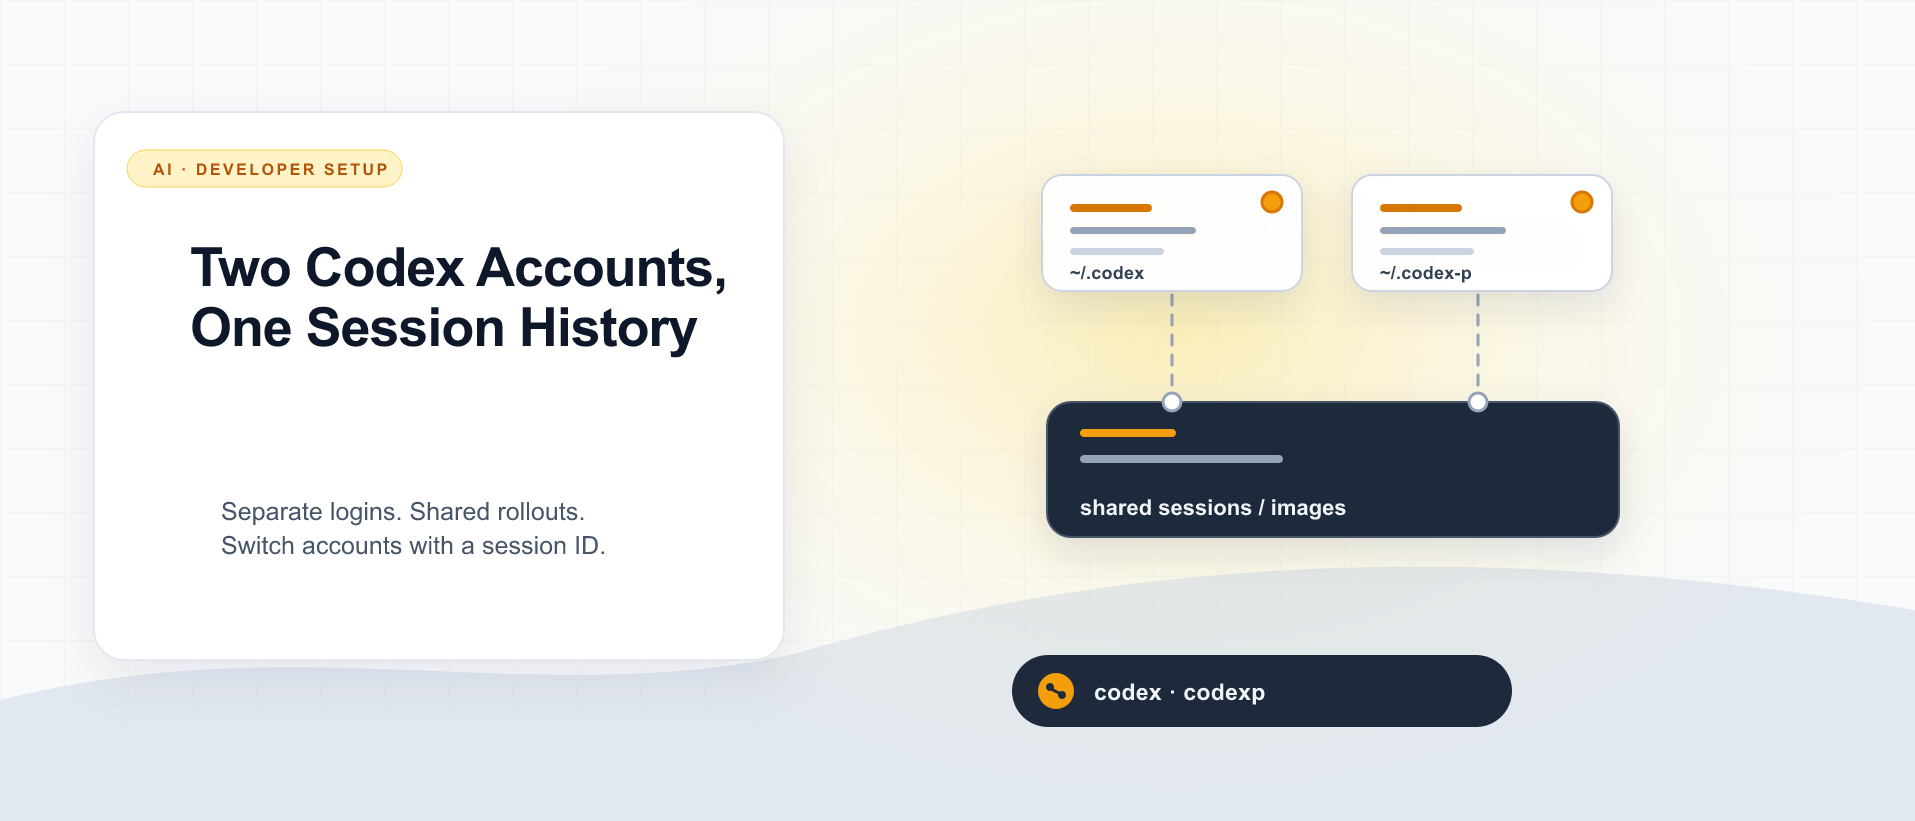
Two Codex Accounts, One Session History
Use CODEX_HOME for a second Codex login, then share only the session files you need to resume by ID. Here is the setup I use, what stays separate, and what I actually verified.
What did you take away?
Thoughts, pushback, or a story of your own? Drop a reply below — I read every one.
Comments are powered by Disqus. By posting you agree to theirterms.